An Introduction to Trend Lines
In the realm of Forex, trend lines function as graphical representations connecting key price points on a chart, showcasing both the direction and vigor of market trends. These lines, drawn by joining either the higher lows of an upward trend or the lower highs of a downturn, serve as visual aids. They offer traders insights into market direction, potential support or resistance zones, and possible trend continuations or reversals.
The power of trend lines isn’t just in their standalone usage. They become even more formidable when coupled with other technical analysis tools, assisting traders in making informed decisions.
Considering their widespread application, understanding the nuances of trend lines becomes paramount. Let’s delve deeper into their types and implications.
Decoding Trend Lines
Trend lines connect pivotal price points on a Forex chart, offering insights into the trajectory and intensity of market trends. They serve as invaluable components in technical analysis, aiding traders in deciphering ongoing market movements and potential resistance or support junctures. Trend lines can be broadly categorized into three types:
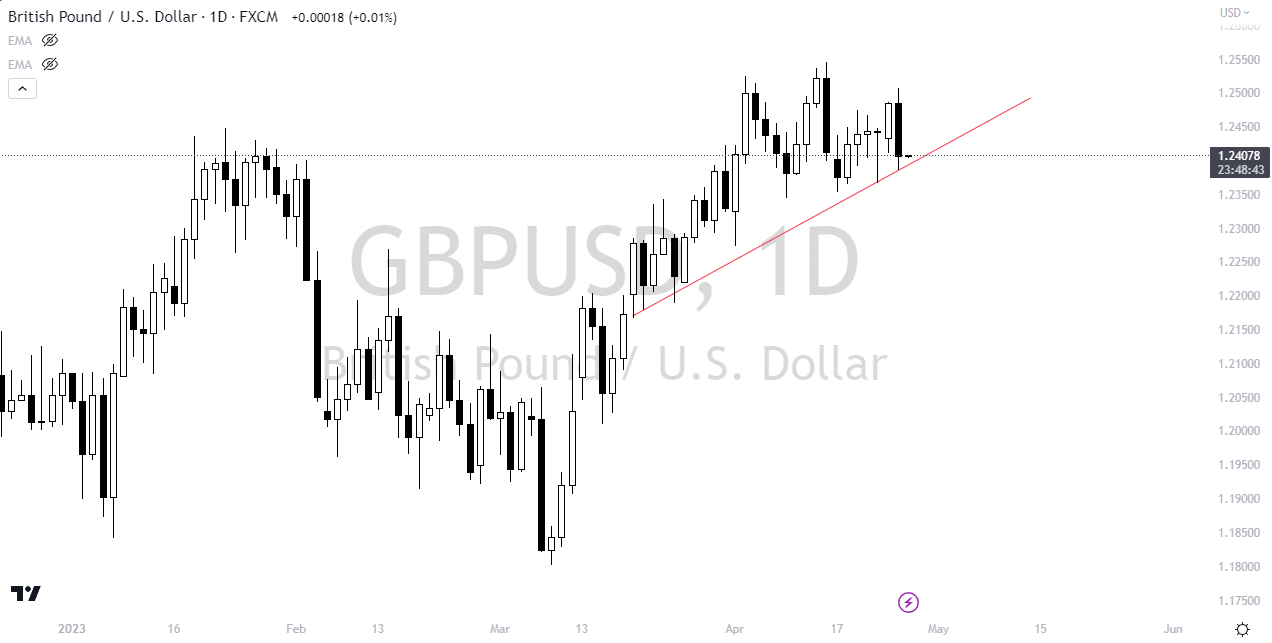
Uptrend Lines
Characterized by an asset or security’s price consistently rising over time, uptrends depict a situation where buyers are dominant, propelling prices upwards. This manifests as a series of higher highs and higher lows in price action. Uptrend lines visually represent these zones of market buoyancy. While they may seem arbitrary to novices, they are often the initial trend lines that traders grow accustomed to. Particularly for those transitioning from stock markets, this kind of "trend trading" becomes intuitive.
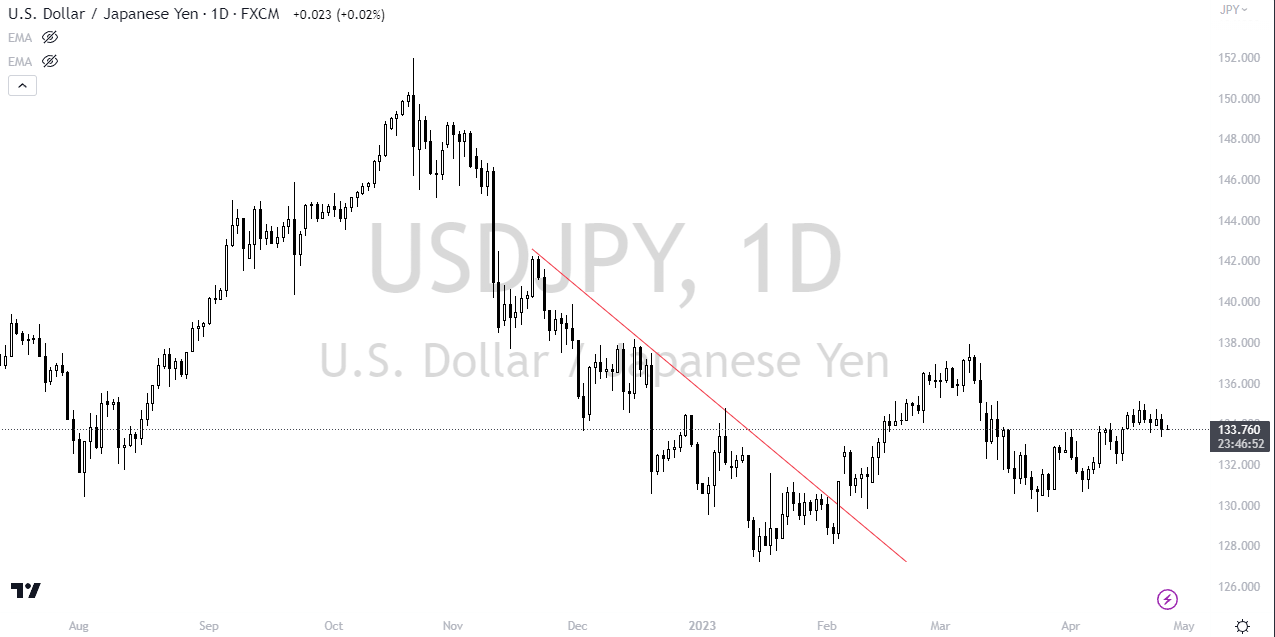
Downtrend Lines
Downtrends depict a contrasting scenario, where the market price of a pair is on a consistent decline. Marked by lower highs and lower lows in price movement, sellers exert their dominance in such scenarios. The accompanying trend line typically slopes downwards, showcasing where the currency pair might encounter dynamic resistance.
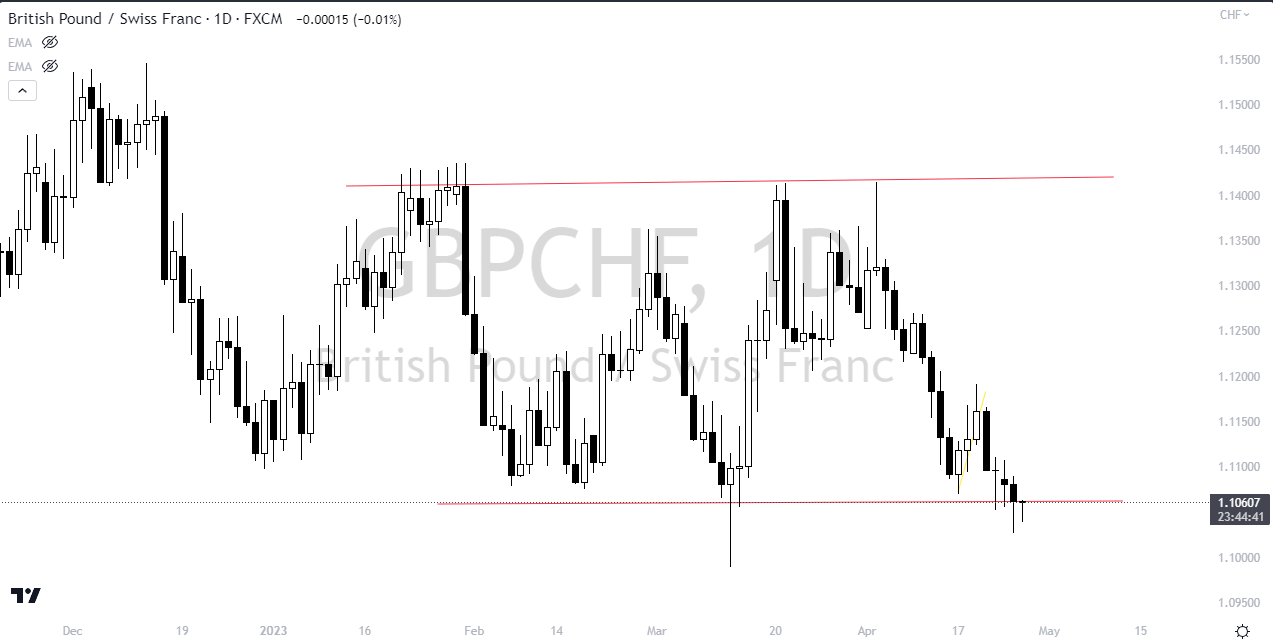
Sideways Trend Lines
Here, the currency pair's price fluctuates within a narrow band, leading to a back-and-forth movement. In a sideways trend, while sellers might drive prices down, buyers frequently intervene, offering support. This oscillation results from market consolidation. The trend lines in such cases, whether indicating support or resistance, tend to be flat.
Trend lines, with their ability to offer traders a visualization of market sentiment and direction, are indispensable tools in Forex trading. By understanding and mastering the art of drawing and interpreting these lines, traders can significantly enhance their prediction accuracy, thus maximizing their potential for success. Whether it's uptrends, downtrends, or the sideways dance, a keen eye on trend lines often spells the difference between a successful trade and a missed opportunity.
Mastering the Art of Trend Lines in Forex Trading
Understanding and drawing trend lines are fundamental skills for any Forex trader. They serve as a visual representation of a currency pair's price movement, helping traders predict potential future movements. But to utilize trend lines effectively, one must not just draw them but also comprehend when and how to adjust and extend them. Here's a deep dive into the art of drawing and fine-tuning trend lines.
Establishing the Trend: The Foundation of Trend Lines
Before sketching a trend line, it's imperative to identify the trend in the pair's price movement. This trend could be bullish (upward) or bearish (downward).
Steps to Construct a Trend Line:
- Recognize the Trend's Nature: By closely observing the price movement, ascertain whether it's in an upward surge or a downward slide. Higher highs and higher lows indicate an uptrend, while lower highs and lower lows signify a downtrend.
- Spot the Swing Points: Swing points are significant peaks (for uptrends) or troughs (for downtrends) in price movement. These are points where the price momentarily reverses its direction. For an uptrend, focus on the swing lows; for a downtrend, zero in on the swing highs.
- Craft the Trend Line: Using the identified swing points, draw a straight line connecting them. This line represents the trend line. To authenticate its validity, ensure it touches at least two distinct swing points.
- Refine the Trend Line: Markets are dynamic, and as price movement evolves, your trend line may need adjustments. Modify the line to encapsulate as many swing points as possible without breaching the price trajectory.
- Affirm the Trend: Post crafting the trend line, reinforce your analysis by integrating other technical tools, such as moving averages, candlestick configurations, and the Relative Strength Index (RSI).
Pinpointing Highs and Lows in Forex Trading
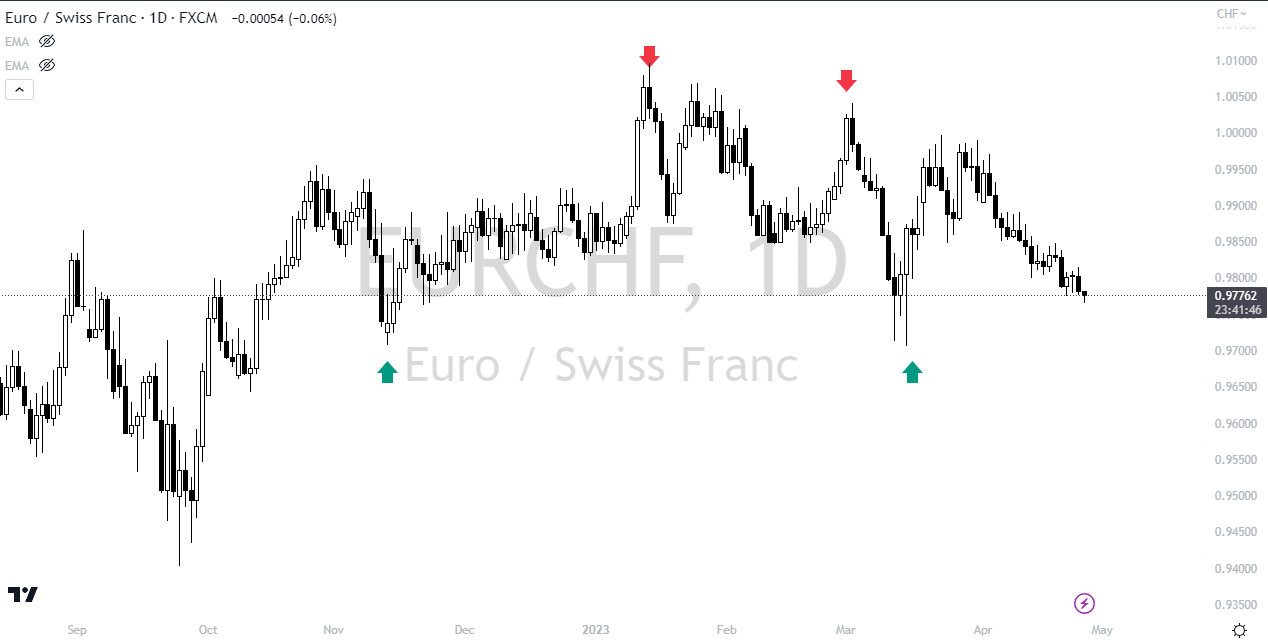
Isolating and connecting highs and lows on a Forex chart is pivotal for crafting precise trend lines.
Guidelines to Detect and Connect Highs and Lows:
- Select Your Time Frame: Depending on your trading strategy, choose a time frame that resonates with your analysis. This could range from a 1-hour to a daily chart.
- Identify Peak and Trough Points: Within your chosen timeframe, locate the zenith and nadir points on the chart. The extremities of the candlestick wicks typically denote these points.
- Sketch the Trend Line: By connecting the two extreme points (either highs for an uptrend or lows for a downtrend), craft your trend line.
- Optimize the Line: Adjust the line to include as many peaks or troughs as possible without distorting the pair's inherent direction.
- Decipher the Trend: With the trend line in place, infer the direction of the trend.
- Expand Your Analysis: To deepen your understanding, consider repeating the process for varied time frames or even other currency pairs. While trend lines are foundational, integrating them with broader analysis will enhance your Forex trading proficiency.
The Nuances of Extending and Adjusting Trend Lines
Drawing trend lines is just the beginning. Their utility and precision can be magnified through extension and adjustment. Understanding Extension: Extending trend lines involves projecting the current trend into the future, offering insights into potential areas of support or resistance. This can be pivotal in anticipating future swing highs or lows. While short-term traders might not rely heavily on this, it's a staple for longer-term Forex strategists.
Mastering Adjustment
The dynamism of the Forex market implies that a trend line might become obsolete or misaligned with the ongoing price movement. Adjusting them is vital to ensure they remain relevant. This could involve repositioning the line vertically or altering its gradient to better align with evolving price data.
Trend lines are more than mere lines on a chart. They are dynamic tools that, when mastered, can greatly amplify a trader's analytical prowess in the Forex market.
Deepening the Understanding of Logarithmic Scales for Long-Term Forex Analysis
Observing a BTC chart or any financial chart, for that matter, one can instantly notice the difference a logarithmic (log) scale brings to the table. The price patterns and their nuances are distinctly presented, illustrating the power of the log scale.
The Essence of Logarithmic Scales
Instead of a conventional linear scale, many traders prefer using a logarithmic scale, especially for long-term price evaluations. In a log scale, as prices ascend, the space between price levels expands, leading to a curved line representation.
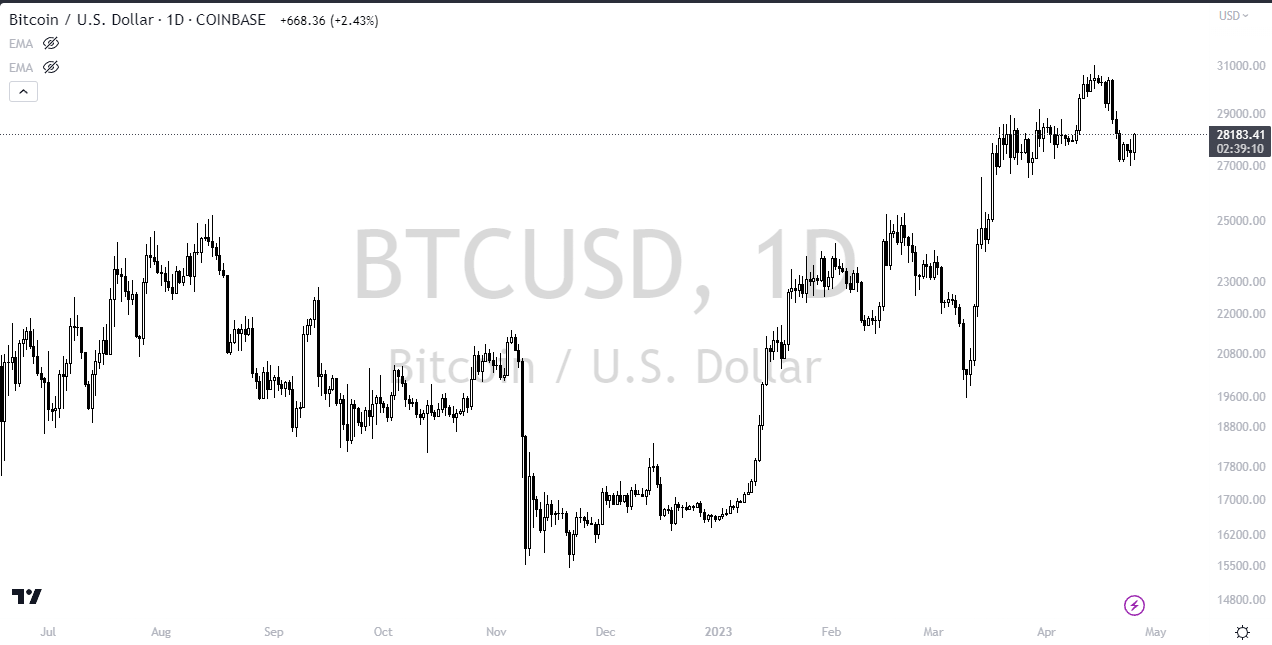
Forex log scale charts boast several advantages:
- Enhanced Visualization: In a linear chart, significant price fluctuations often overshadow smaller movements. Log charts amplify these minor price shifts, enabling traders to perceive both major and minor variations effectively.
- Optimized Trend Analysis: The logarithmic scale is revered for its capacity to highlight key price levels and shifts in trend direction, especially in the long term. This is because professionals tend to think in terms of relative percentage changes, which log scales epitomize more aptly. Consequently, opportunities for line trading in Forex become more pronounced.
- User-friendliness: Many contemporary trading platforms seamlessly integrate log scales, allowing traders to effortlessly toggle between linear and log perspectives, fostering efficient price evaluations.
- Uniform Percentage Display: Unlike linear scales that show absolute value changes, log scales present uniform percentage changes vertically. This is instrumental for traders who prioritize relative price amplitude over absolute price shifts.
Trend Lines: Amplifying Trading Strategies
Merely relying on trend lines might not suffice for seasoned traders. To bolster their trading accuracy, they often couple trend lines with other pivotal indicators.
Trend Line Breakouts
The moment a currency pair's price intersects a trendline, it could be a harbinger of an impending trend shift, termed a trendline breakout. This is a fundamental strategy for many, from day traders to long-term investors.
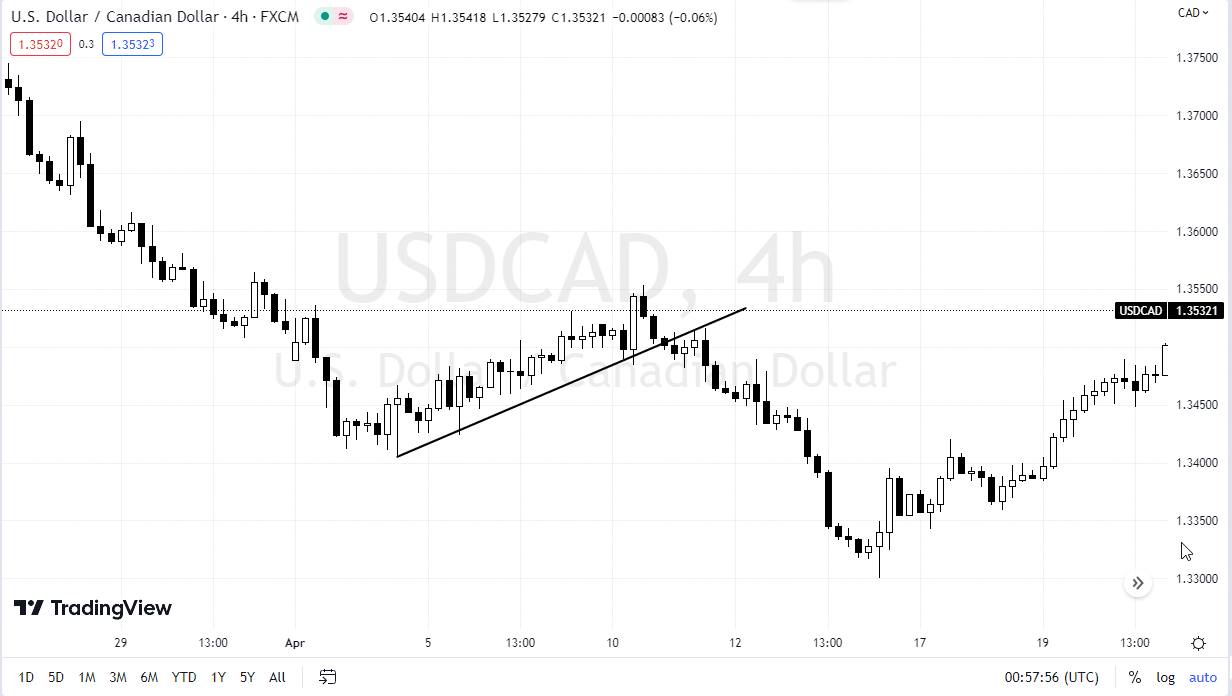
Steps for Trading Trendline Breakouts:
- Identify the Trendline: Establish a trendline by linking the highs or lows on your chart. Ensure its validity by having it touch at least two or three distinct points.
- Anticipate the Breakout: Monitor for a price shift crossing the trendline.
- Authenticate the Breakthrough: Confirm the breakout's legitimacy by observing a spike in volume and momentum.
- Execute the Trade: Based on breakout verification, take your position. Set a protective stop loss to mitigate potential risks.
- Oversee the Trade: Continuously track and adjust your position to safeguard profits or even reach a breakeven status.
- Realize Profits: Upon spotting signs of trend inversion, close the position and capitalize on your gains.
Trend Line Bounces
A trendline bounce occurs when the price gravitates towards a trendline and then ricochets in the direction of the prevailing trend. This phenomenon can act as a potent signal for traders.
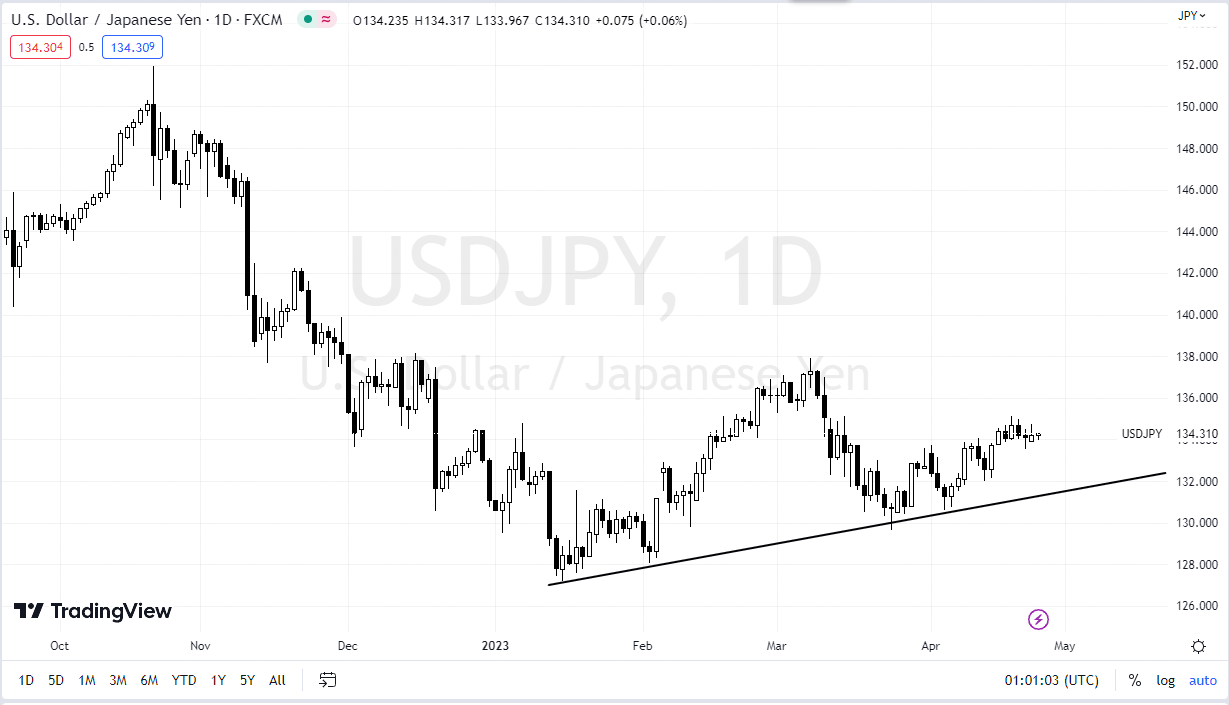
Steps for Trading Trendline Bounces:
- Spot the Trendline: As with breakouts, initiate by drawing the trendline, ensuring it's tested multiple times.
- Hold for the Rebound: As the price approaches the trendline, stay on the lookout for a bounce.
- Validate the Bounce: Identify strong candlestick patterns or a surge in volume to confirm the bounce's direction.
- Initiate the Trade: Based on the bounce verification, decide your trading position. Implement a stop loss to circumvent unforeseen losses.
- Supervise the Trade: Continually adapt your position based on the evolving price action.
- Secure Profits: If signs of a counter-trend emerge, it's prudent to close the position and lock in the profits.
To conclude, while trend lines are invaluable, understanding the nuances of the tools, such as logarithmic scales and integrating them with other strategies, can significantly augment a trader's prowess in the dynamic world of Forex.
Enhancing Trend Line Analysis with Additional Technical Tools
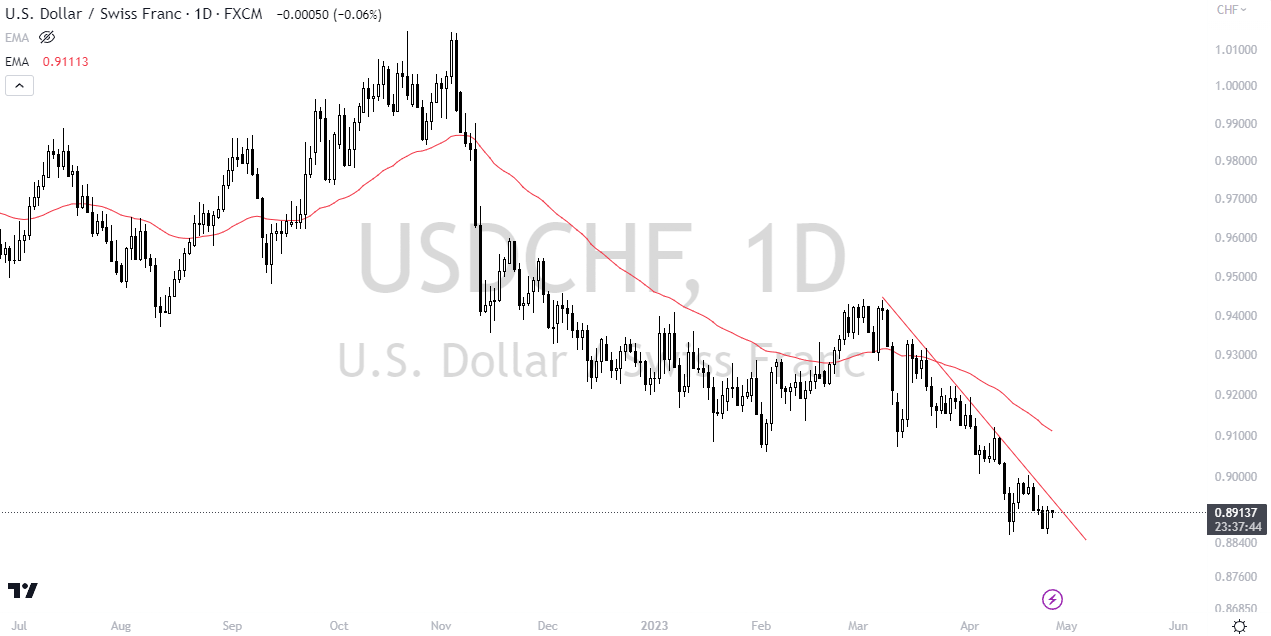
The USD/CHF price illustration reveals the overarching downward momentum with both a trend line and an Exponential Moving Average (EMA). Traders have long understood the value of integrating trend lines with other technical indicators to reinforce trading signals and delineate more precise entry and exit points. By blending different technical tools, traders can significantly diminish the risk of false signals and amplify the precision of their trading decisions. It's worth noting that a long-term trend line usually carries more weight in its implications.
One effective way to complement trend line analysis is by integrating oscillators such as the Relative Strength Index (RSI) or the Stochastic Oscillator. For example, when a trend line is breached, and simultaneously, RSI suggests an overbought or oversold scenario, it can signify an impending trend reversal. Such a confluence of indicators can present a compelling argument for traders to either initiate a buy or sell position.
Moving averages, too, can be a robust ally in this analytical quest. Consider a scenario where a bullish trend line aligns with the price being above its 50-day moving average; this convergence often validates the upward momentum, a situation commonly leveraged by seasoned Forex professionals.
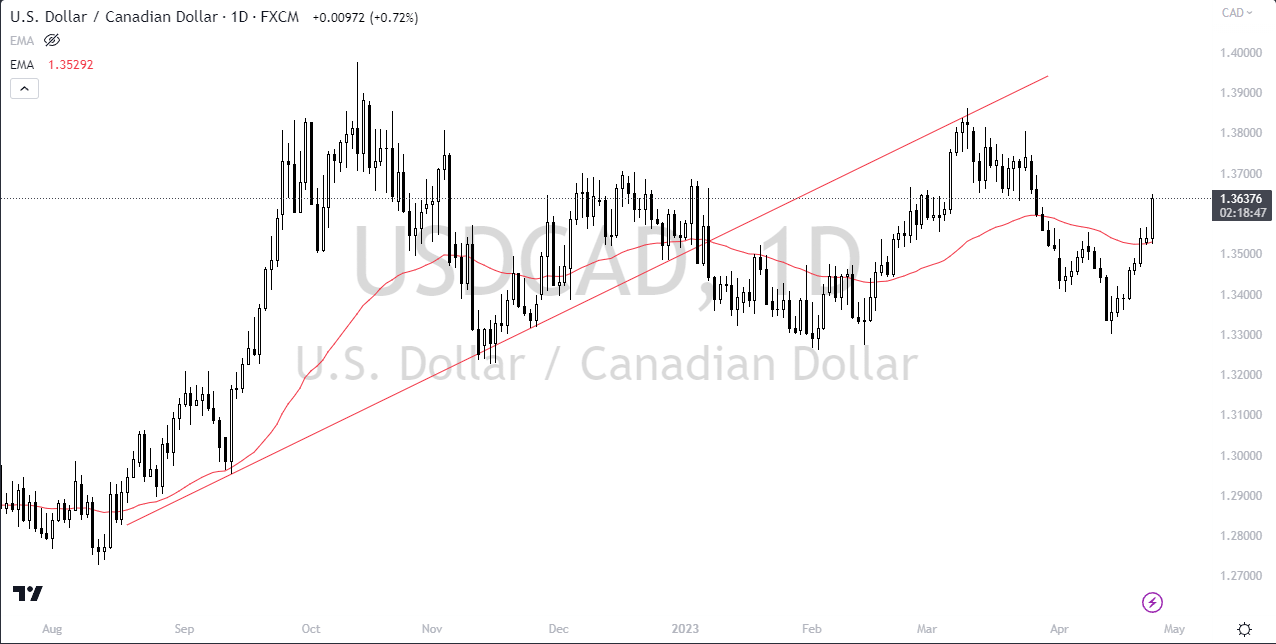
Tools like Bollinger Bands, Fibonacci retracements, and other moving averages can also be juxtaposed with trend lines to spotlight potential support and resistance zones, further bolstering the reliability of trading signals. Referencing our example, the combination of a trend line breach and the 50-Day EMA dipping beneath it resulted in a market pullback, accentuating the value of dual validation.
Understanding the Limitations of Trend Lines
Despite the significant insights offered by trend lines in Forex analysis, they come with inherent challenges:
- Subjectivity: Different traders might interpret and draw trend lines in diverse ways, leading to varying interpretations, which may sometimes conflict.
- False Breakouts: On occasions, prices may breach a trend line only to revert, leading to deceptive signals which could adversely influence trading decisions.
- Nature of Being a Lagging Indicator: Since trend lines reflect past data, they don't necessarily predict future movements, possibly limiting their proactive value.
- Whipsaw Patterns: Due to inherent market volatility, prices can frequently oscillate across a trend line, complicating the interpretation of genuine trend breaches.
- Overdependence: Solely relying on trend lines, without factoring in other market indicators or economic news, might limit trading potential and overlook broader market dynamics.
Thus, while trend lines hold undeniable significance in Forex trading, their optimal use is when they're complemented with other analytical tools.
Strategies for Trend Line Mastery
- Trend Recognition: Understand the broader market trend using trend lines. Aligning with the prevailing trend, rather than opposing it, often yields more favorable trading outcomes.
- Validation: For a trend line to be genuinely indicative, it should touch price points at least thrice, providing a more robust analytical foundation.
- Holistic Analysis: Consider integrating various indicators alongside trend lines to optimize trading efficiency and accuracy.
It's vital for traders to recognize that trading is an evolving journey. Continuous learning, updating strategies, and leveraging the right tools form the cornerstone of trading success.
In Conclusion
Trend lines, despite their apparent simplicity, are an invaluable compass guiding traders in the vast Forex sea. They provide an initial roadmap for discerning market direction, a fundamental step towards profitable trading. Engaging with the market's flow, rather than against it, is the mantra for success.
While trend lines offer an elementary analytical framework, their efficacy is magnified when combined with other technical indicators. This harmonious fusion not only assists in visualizing market sentiment but also ensures traders remain on the correct side of the trade, maximizing profitability and minimizing potential losses.
Related Materials
The forex market has witnessed a rise in the popularity of Percentage Allocation Management Module (PAMM) services, as both retail traders and institutional investors seek out ways to diversify their portfolios and earn passive income. As 2023 unfolds, it's pivotal to identify which brokers are at the forefront of offering top-notch PAMM services..
Copy trading, a revolutionary method in the trading world, has emerged as a boon for both seasoned traders and beginners. It's an automation process that allows traders to mirror the moves of more experienced counterparts.
If the concept of hedging in the world of Forex has left you intrigued, search no further. This comprehensive article will unravel the intricacies of Forex hedging, furnish you with a practical example of a Forex hedging strategy, and delve into the "Hold Forex Strategy" and more.
The Forex market is the largest financial market globally, with a daily trading volume exceeding $6 trillion. Forex trading has become increasingly accessible to retail traders, thanks to the proliferation of online Forex brokers. However, selecting the right broker is a critical decision that can significantly impact your trading success.
Leverage is a powerful tool in the world of forex trading. It allows traders to control a large position size with a relatively small amount of capital, amplifying both profits and losses. While leverage can enhance potential gains, it also comes with significant risks. Therefore, choosing the right forex broker and evaluating their leverage offering is crucial for traders seeking success in the competitive forex market.
In the vast and dynamic landscape of global finance, the Forex market reigns supreme, presenting both unparalleled opportunities and significant challenges. At the heart of this complex ecosystem is the principle of risk management, a foundational pillar for anyone looking to navigate the often turbulent waters of Forex trading. In essence, risk management in Forex trading isn't merely a safety mechanism; it's an integral part of a holistic trading strategy, ensuring sustainability, promoting discipline, and maximizing the potential for success.
Brokers have a variety of ways in which they charge traders for their services. Understanding these fees and commissions is crucial for any trader who wants to manage their trading costs effectively.
The dynamics of the Forex market have dramatically evolved over the past few years, not just in terms of technology and tools, but also in how traders interact and share information...
Currency exchange rates are one of the most closely watched and analyzed metrics in the global financial market. Every day, businesses, tourists, governments, and traders seek to understand and anticipate changes in these rates, as they affect everything from the price of your morning coffee to billion-dollar business deals...
In the rapidly evolving world of online trading, where decision-making speed, strategy efficacy, and real-time responsiveness play crucial roles, preparation becomes paramount. This is where demo accounts enter the scene, offering aspirants and seasoned traders alike an invaluable platform. Designed to mimic real-world trading conditions without actual financial risk, demo accounts serve as a bridge between theoretical knowledge and real-world trading execution. They provide an arena for traders to practice, learn, and refine their strategies, ensuring they're equipped with the experience and confidence needed to navigate the often tumultuous waters of the financial markets.
Trusted Forex Brokers
| Broker | Review | Rating | |
|---|---|---|---|
| 1 | HF Markets | ||
| 2 | NordFX | ||
| 3 | Octa | ||
| 4 | FXCM | ||
| 5 | Interactive Brokers | ||
| 6 | ActivTrades | ||
| 7 | FXTM | ||
| 8 | easyMarkets | ||
| 9 | HYCM | ||
| 10 | SaxoBank | ||
| 11 | FxPro | ||
| 12 | Moneta Markets | ||
| 13 | XM | ||
| 14 | FOREX.com | ||
| 15 | Admirals | ||
| 16 | eToro | ||
| 17 | FIBO Group | ||
| 18 | Pepperstone | ||
| 19 | PrimeXBT | ||
| 20 | IronFX | ||
| 21 | Forex4you | ||
| 22 | InstaForex | ||
| 23 | INGOT Brokers | ||
| 24 | Swissquote Bank | ||
| 25 | Oanda |


